Previously I have talked about noise in the measurements that are used to control the process. These variations can cause the system to react unnecessarily and introduce disturbances to the process.
While we should always try to avoid noise by selecting suitable instruments and installing them in the correct positions, there will usually always be some level of noise. Sometimes the level of noise can't be reduced any further and yet it still causes problems. In these cases, we can often use a filter to reduce the noise.
When I say filter, I am talking about an algorithm, a calculation done to the signal, not the piece of metal mesh that is put in the middle of a pipe. Though in some ways the do the same job. The bit of metal in a pipe catches solid objects and lets the liquid through. Ideally our algorithm would ‘catch’ the noise and let the real signal through.
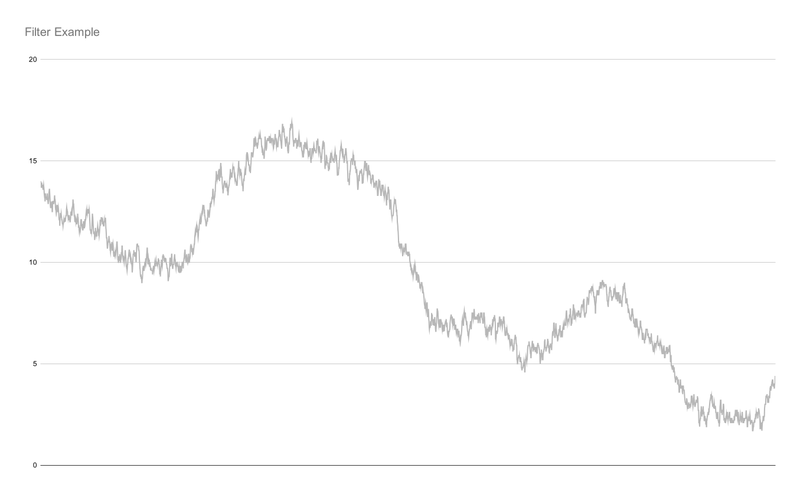
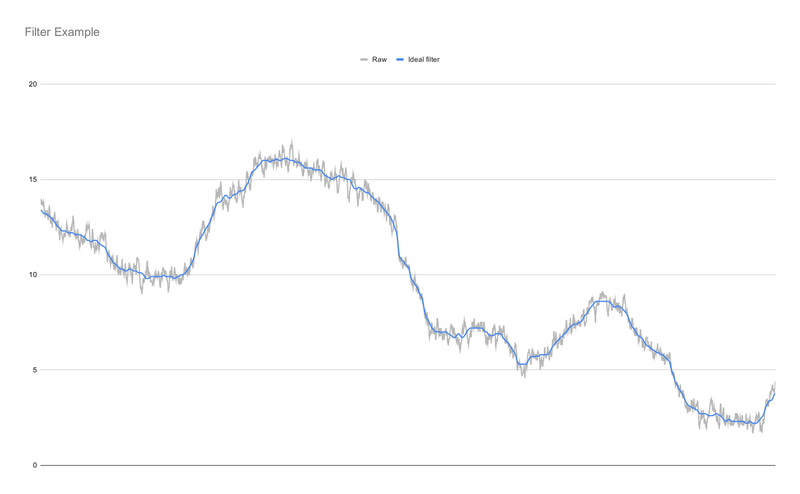
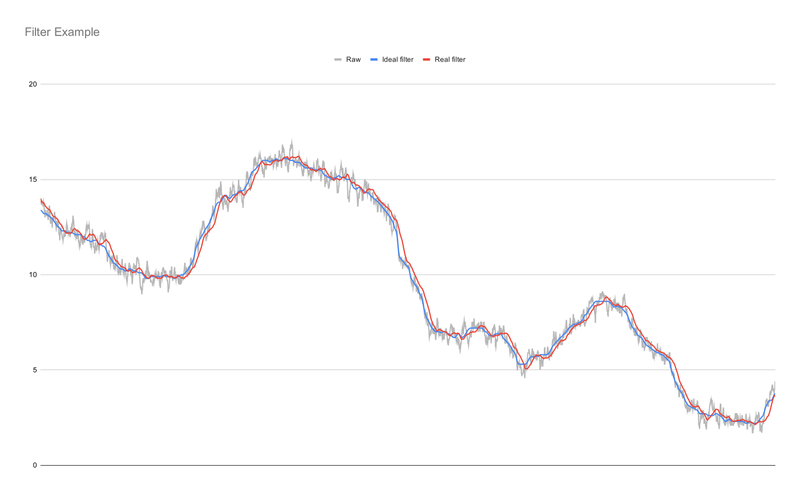
Looking at our graph again, I have added an ‘ideal’ filtered signal. In this case, the smooth line moves with the original raw signal, but doesn’t bounce around as much. If the control system could use this signal, it would have no problems controlling the process without adding its own disturbances to the process. Unfortunately, this ideal signal is impossible to get. To generate it, I had to cheat. I had already recorded the raw signal, and so the filter can ‘see’ into the future. The calculation looks at what the signal had done and what will happen in the future, so it knows when a movement in a direction is real or just more noise.
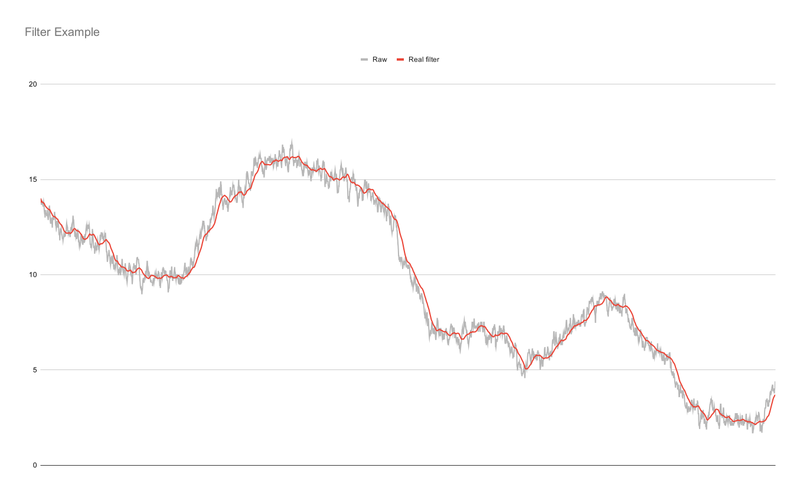
In the real world we can’t see into the future. We can only use the data that we have already seen.
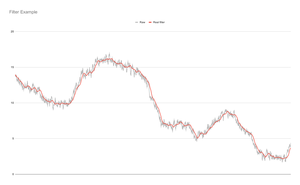
As a result of not knowing what is about to happen, the filter can only see the past. It ends up lagging the real signal. The way the filter works is by averaging what the previous signal has been. When the sigal moves in one direction, it is initially ignored because it is probably just noise. It is only once several readings have all moved in the same direction that the filter starts to move as well. This means that the controller will not notice a real change to the process immediately.
Applying a long filter would mean that you end up with a very smooth signal, no noise would get through. But the real signal would also get lost, it would take a long time before the controller starts to respond to a genuine upset.
Decreasing the length of the filter, would allow the system to be more responsive, though would allow more noise back into the final signal. Picking the correct length of filter is another form of tuning and needs to be done by observing the process, trying something and seeing what works.
Filters are a useful tool, though they are a bit of a work around. Ideally we wouldn’t need them, but it is really useful to have them when we do.
Go Top« Changing the Plan
Deciding What Not To Do »


Comments
I would love to know what you think. To comment on this article, send me an email
No comments yet.